
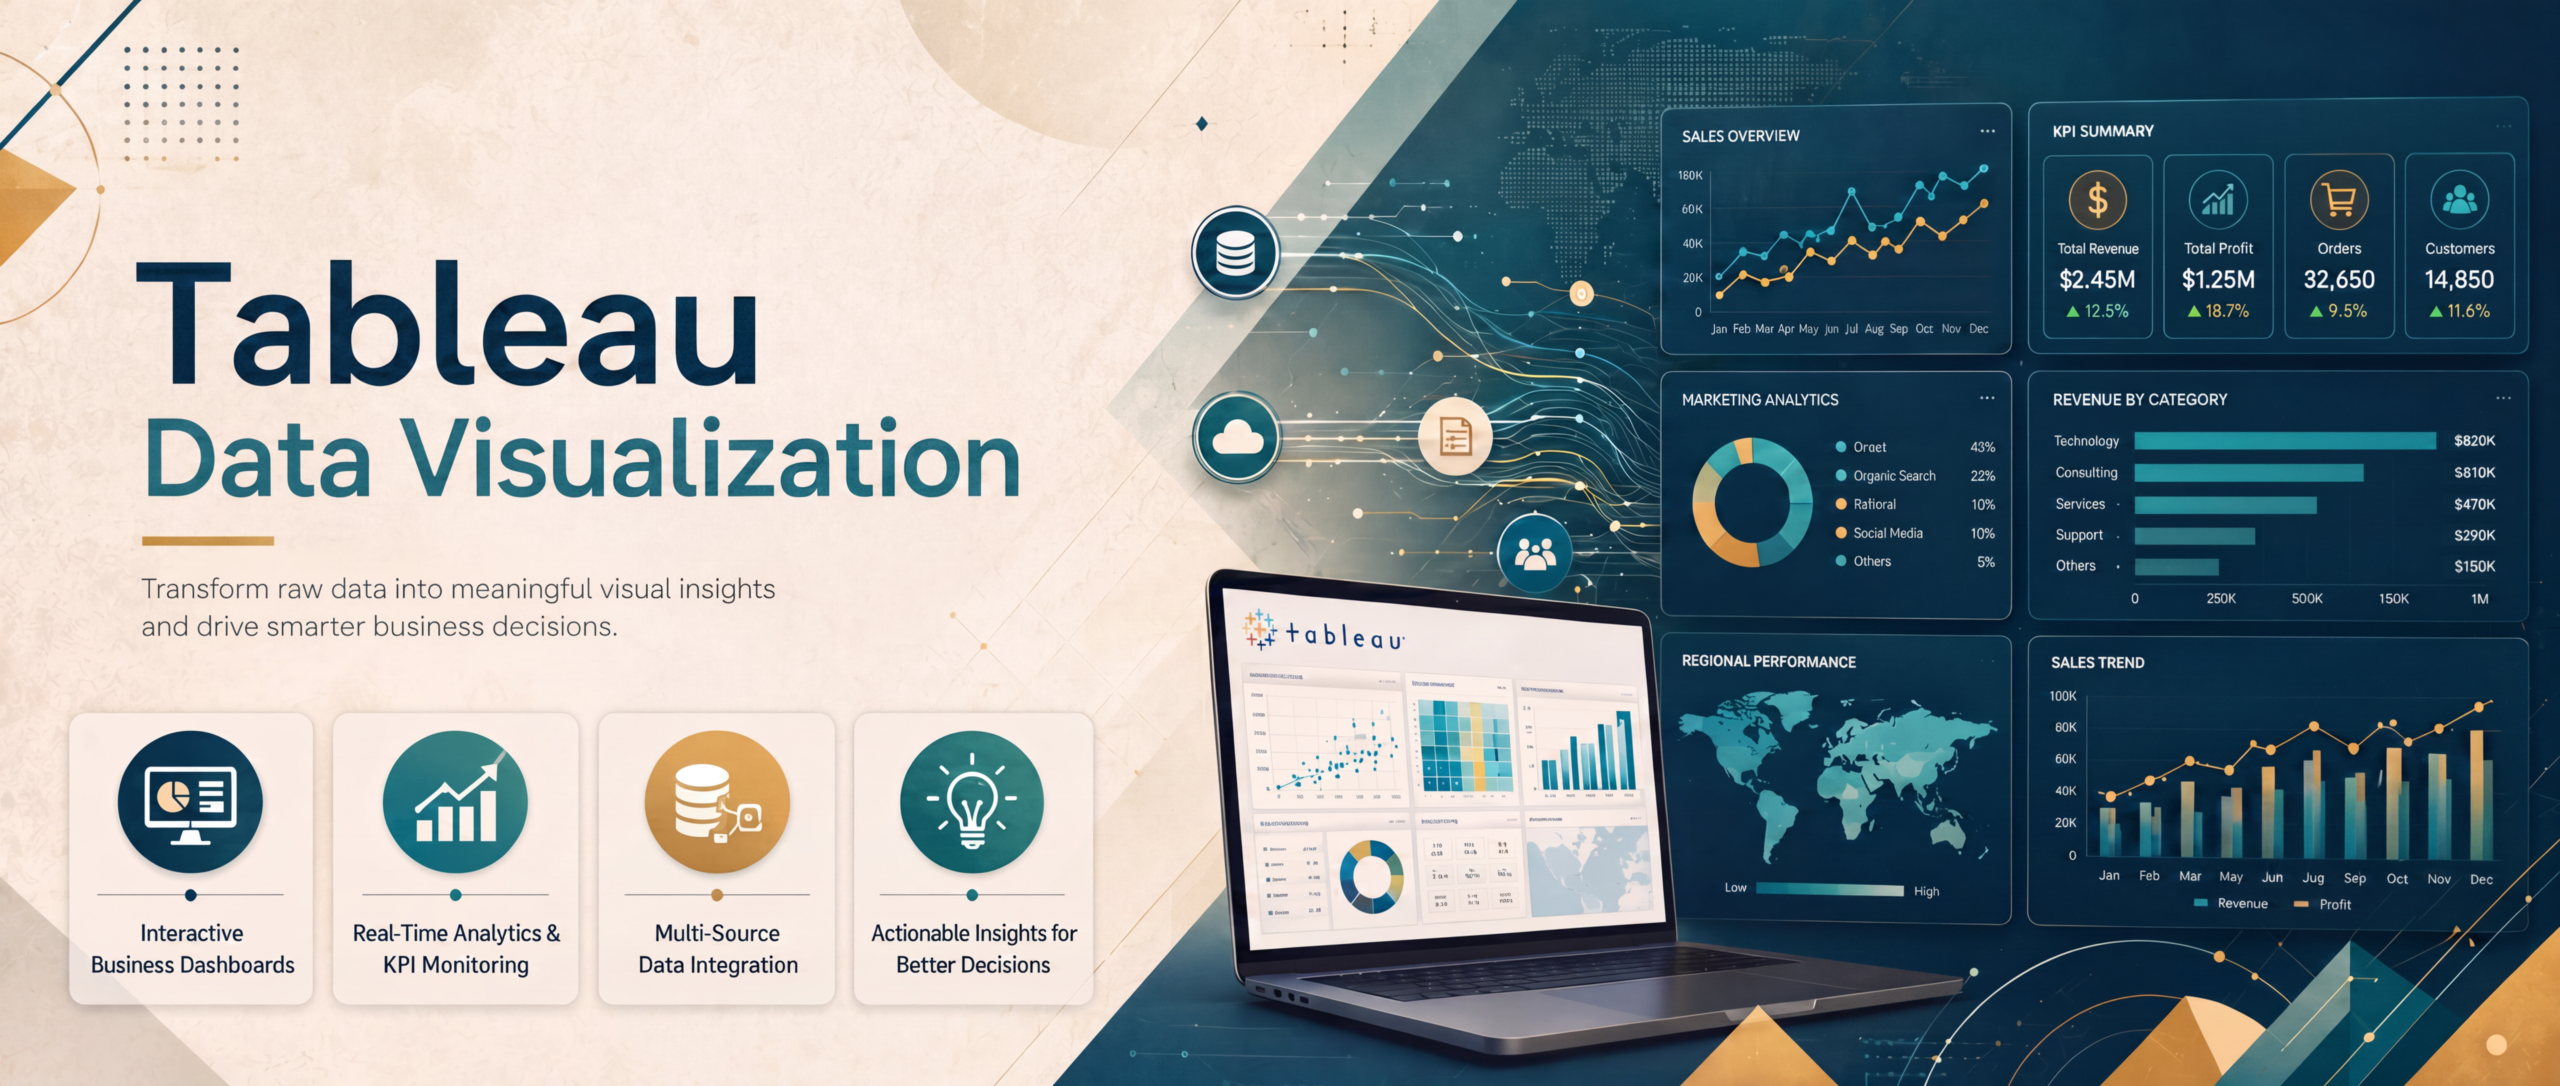
Tableau Data Visualization: From Data to Decisions
In today’s data-driven business environment, organizations generate vast amounts of information every day. However, raw data alone does not create value unless it is transformed into meaningful insights. Tableau data visualization empowers businesses to convert complex datasets into interactive dashboards and visual reports, enabling faster and more informed decision-making. Whether analyzing sales performance, customer behaviour, financial metrics, or operational efficiency, Tableau helps organizations simplify data interpretation and uncover actionable insights that drive business growth.
Why Tableau Data Visualization Is Essential for Modern Businesses?
Businesses often struggle with scattered data across multiple systems, making it difficult to gain a unified view of performance. Tableau data visualization bridges this gap by presenting data in intuitive charts, graphs, heat maps, and dashboards that anyone in the organization can understand.
Instead of spending hours interpreting spreadsheets, decision-makers can instantly identify trends, monitor KPIs, detect anomalies, and forecast future outcomes. Tableau’s interactive features allow users to drill down into data, filter information, and explore different perspectives without requiring advanced technical expertise.
With self-service analytics becoming increasingly important, data visualization tableau enables business users to answer questions independently while reducing dependency on IT teams.
Tableau Data Visualization Services That Deliver Business Value
Professional tableau data visualization services help organizations maximize the capabilities of Tableau by designing dashboards that align with specific business objectives.
These services typically include:
- Interactive dashboard development
- Executive reporting solutions
- KPI monitoring dashboards
- Data integration from multiple sources
- Automated reporting
- Performance optimization
- Data governance implementation
- Mobile-friendly dashboard design
Organizations across industries—including healthcare, manufacturing, retail, finance, logistics, and technology – use Tableau to visualize operational and strategic data in real time.
Instead of relying on static reports, businesses gain dynamic dashboards that continuously update as new data becomes available.
Tableau Data Visualization Consulting for Strategic Analytics
Implementing Tableau successfully requires more than installing software. Effective tableau data visualization consulting ensures organizations build scalable analytics environments that support long-term business goals.
Consulting services often focus on:
1. Understanding Business Requirements
Every organization has different reporting needs. Consultants identify critical business questions before designing dashboards that provide meaningful answers.
2. Data Architecture Planning
Well-structured data is the foundation of effective visualization. Consulting experts evaluate data quality, integration methods, and data models to ensure accurate reporting.
3. Dashboard Design Best Practices
Good dashboards communicate insights clearly. Consulting teams create layouts that emphasize usability, consistency, and intuitive navigation while avoiding unnecessary complexity.
4. User Adoption Strategy
Even the best dashboards deliver little value if employees do not use them. Consulting includes user training, governance policies, and change management to encourage organization-wide adoption.
5. Performance Optimization
As data volumes grow, dashboard performance becomes increasingly important. Optimization techniques help maintain fast loading times and responsive user experiences.
Strategic consulting enables businesses to build analytics ecosystems that remain effective as organizational needs evolve.
Understanding Data Visualization Tableau for Better Decision Making
Effective data visualization tableau solutions transform complex information into visual stories that support smarter business decisions.
Some common visualization types include:
- Interactive Dashboards: Combine multiple visualizations into a single workspace where users can monitor business performance in real time.
- Trend Analysis: Line charts and historical comparisons help identify seasonal patterns, growth trends, and performance fluctuations.
- Geographic Mapping: Businesses operating across multiple regions can analyze location-based performance using interactive maps.
- Sales Performance Analysis: Sales managers can monitor revenue by product, region, customer segment, or sales representative through dynamic dashboards.
- Financial Reporting: Finance teams gain better visibility into expenses, profitability, budgets, forecasts, and cash flow using customized reports.
- Operational Monitoring: Manufacturing and operations teams can track production efficiency, equipment utilization, inventory levels, and supply chain performance.
These visualizations simplify complex data while enabling users to quickly recognize opportunities and potential risks.
Exploring Tableau Data Visualization Capabilities
One of Tableau’s greatest strengths lies in its extensive tableau data visualization capabilities, which support organizations of every size.
Key capabilities include:
1. Seamless Data Connectivity
Tableau connects with hundreds of data sources, including:
- SQL databases
- Cloud platforms
- Excel spreadsheets
- ERP systems
- CRM platforms
- Data warehouses
- Big data environments
- APIs and web services
This flexibility enables businesses to consolidate information from multiple systems into unified dashboards.
2. Real-Time Analytics
Organizations can monitor live business performance through dashboards that automatically refresh as new data becomes available.
3. Advanced Analytics
Tableau supports predictive analytics, forecasting, trend analysis, statistical modeling, and integration with programming languages like Python and R.
4. Interactive User Experience:
Users can:
- Filter reports instantly
- Drill into detailed records
- Compare multiple metrics
- Create custom views
- Share dashboards securely
These interactive features make analytics more engaging and actionable.
5. Mobile Accessibility
Executives and managers can securely access dashboards from smartphones and tablets, enabling data-driven decisions from virtually anywhere.
Collaboration Features: Teams can publish dashboards, share insights, schedule reports, and collaborate across departments while maintaining secure access controls.
Best Practices for Successful Tableau Implementation
Organizations achieve greater success when they follow proven implementation strategies.
Some recommended best practices include:
- Define clear business objectives before building dashboards.
- Ensure high-quality, accurate, and consistent data.
- Design dashboards with simplicity and usability in mind.
- Limit unnecessary visual elements that distract from insights.
- Establish data governance and security policies.
- Train business users on dashboard interpretation and self-service analytics.
- Continuously review dashboards to reflect changing business priorities.
- Monitor dashboard performance and optimize as data volumes grow.
Following these practices helps organizations maximize the long-term value of their Tableau investment.
The Future of Tableau Data Visualization
Business intelligence continues to evolve with artificial intelligence, machine learning, and automated analytics becoming increasingly integrated into visualization platforms.
Modern Tableau data visualization capabilities now support:
- AI-assisted data exploration
- Natural language queries
- Predictive insights
- Automated anomaly detection
- Personalized dashboards
- Cloud-native analytics
- Enhanced data storytelling
As organizations continue generating larger volumes of data, visual analytics will play an even greater role in strategic planning and operational excellence.
Connect with Fidel for Tableau Data Visualization Services
Organizations today need more than reports—they need meaningful insights that support confident, data-driven decisions. Tableau data visualization enables businesses to transform raw information into interactive dashboards that improve visibility, simplify analysis, and accelerate decision-making across every department.
At Fidel, we help organizations unlock the full potential of Tableau through customized dashboard development, analytics implementation, data integration, and visualization solutions tailored to business goals. Whether you’re looking to modernize reporting, improve operational visibility, or build an enterprise-wide analytics strategy, our team can help you leverage Tableau to turn data into actionable business intelligence. Connect with us at sales@fidelsoftech.com.
Ref. No – FB07261111
Related Blogs

A Smarter Power BI Alternative: Spoggle AI
The data analytics landscape is changing fast. Businesses that once relied on traditional BI tools like Microsoft Power BI are increasingly finding...

Choosing Between Outsourcing vs Staff Augmentation for Software Development
Are you looking to develop a software solution for your company but wondering whether to go for outsourcing vs staff augmentation? Then, let us tell...
Custom Accounting Software Development for Industry-Specific Needs
Custom accounting software development becomes essential when businesses rely on accounting systems that promise universal compatibility,...